
Portfolio
Project overview
With the addition of non-real estate asset classes, the way Fundrise visually communicated allocation and performance needed to change. We believed that displaying both allocation and performance by asset class in the same view would allow our investors to better understand the overall performance of their portfolio – thus I was tasked with merging the two disparate Performance and Portfolio views. This new portfolio experience was the most significant change to the product since Fundrise’s inception.
Goals
Make clear the connection between asset class and performance
Establish levels of information density – from overview to detail rich
Create an experience flexible enough to accommodate both novice and experienced investors
Process Overview
Establishing categorization and hierarchy of asset classes accompanied by validation conducted via investor interviews.
Ideation around layout, structure, and interaction in low fidelity – consulting engineers along the way.
High-Fidelity mockups and Figma prototypes
Review of prototypes with both investors and non-investors.
Final polish
LOW-Fi
Wireframe documentation coming soon *
Portfolio overview
From highest level overview to the most detailed look at the makeup of an investor’s portfolio


main portfolio touchpoints
JUMBO CHIPS
Investors have the ability to look at the overall performance of their account or by a specific asset class (e.g. Real Estate or Growth Equity) with the use of “Jumbo Chips” that include the percentage of funds allocated to a specific asset class.
KEY PERFORMANCE METRICS
Front and center on the page is a table breakdown of the key performance metrics we know our investors care about.
TIME HORIZON FILTERS
Time horizon chips centered in the page allow an investor to view the performance of their investments over default and custom time horizons. When setting a custom time horizon, investors select a single performance period. Setting a custom range is on the product road map for a future release.

BY ASSET TYPE BREAKDOWN
Allocation and performance by asset type

VIEW BY DOLLARS OR PERCENT
The ability to view the asset class breakdown allocation and performance metrics in terms of dollars or percent.
Asset type details
After drilling into a specific asset type, investors have the ability to slice it three different ways – by fund, by investment strategy, and by property type

PERFORMANCE
After tapping into a specific asset type, investors can view a performance chart specific to that asset type
FUND
Investors can view the allocation to and performance of each fund in their portfolio. Should investors want even more detailed information, they have the ability to drill down to a fund detail view.
PROPERTY TYPE
On the property type tab, Investors can view the allocation to and performance of each property type. Tapping on a specific row will take the investor to the list of properties list filtered by that category.
STRATEGY
Under the strategy tab, investors can view the allocation to and performance of each investment strategy in their portfolio. Investors can tap into a specific investment strategy to view the associated projects.
Full screen charting
Accessible from the main portfolio experience as well as from any asset type detail view, investors have the ability to maximize the data visualizations.
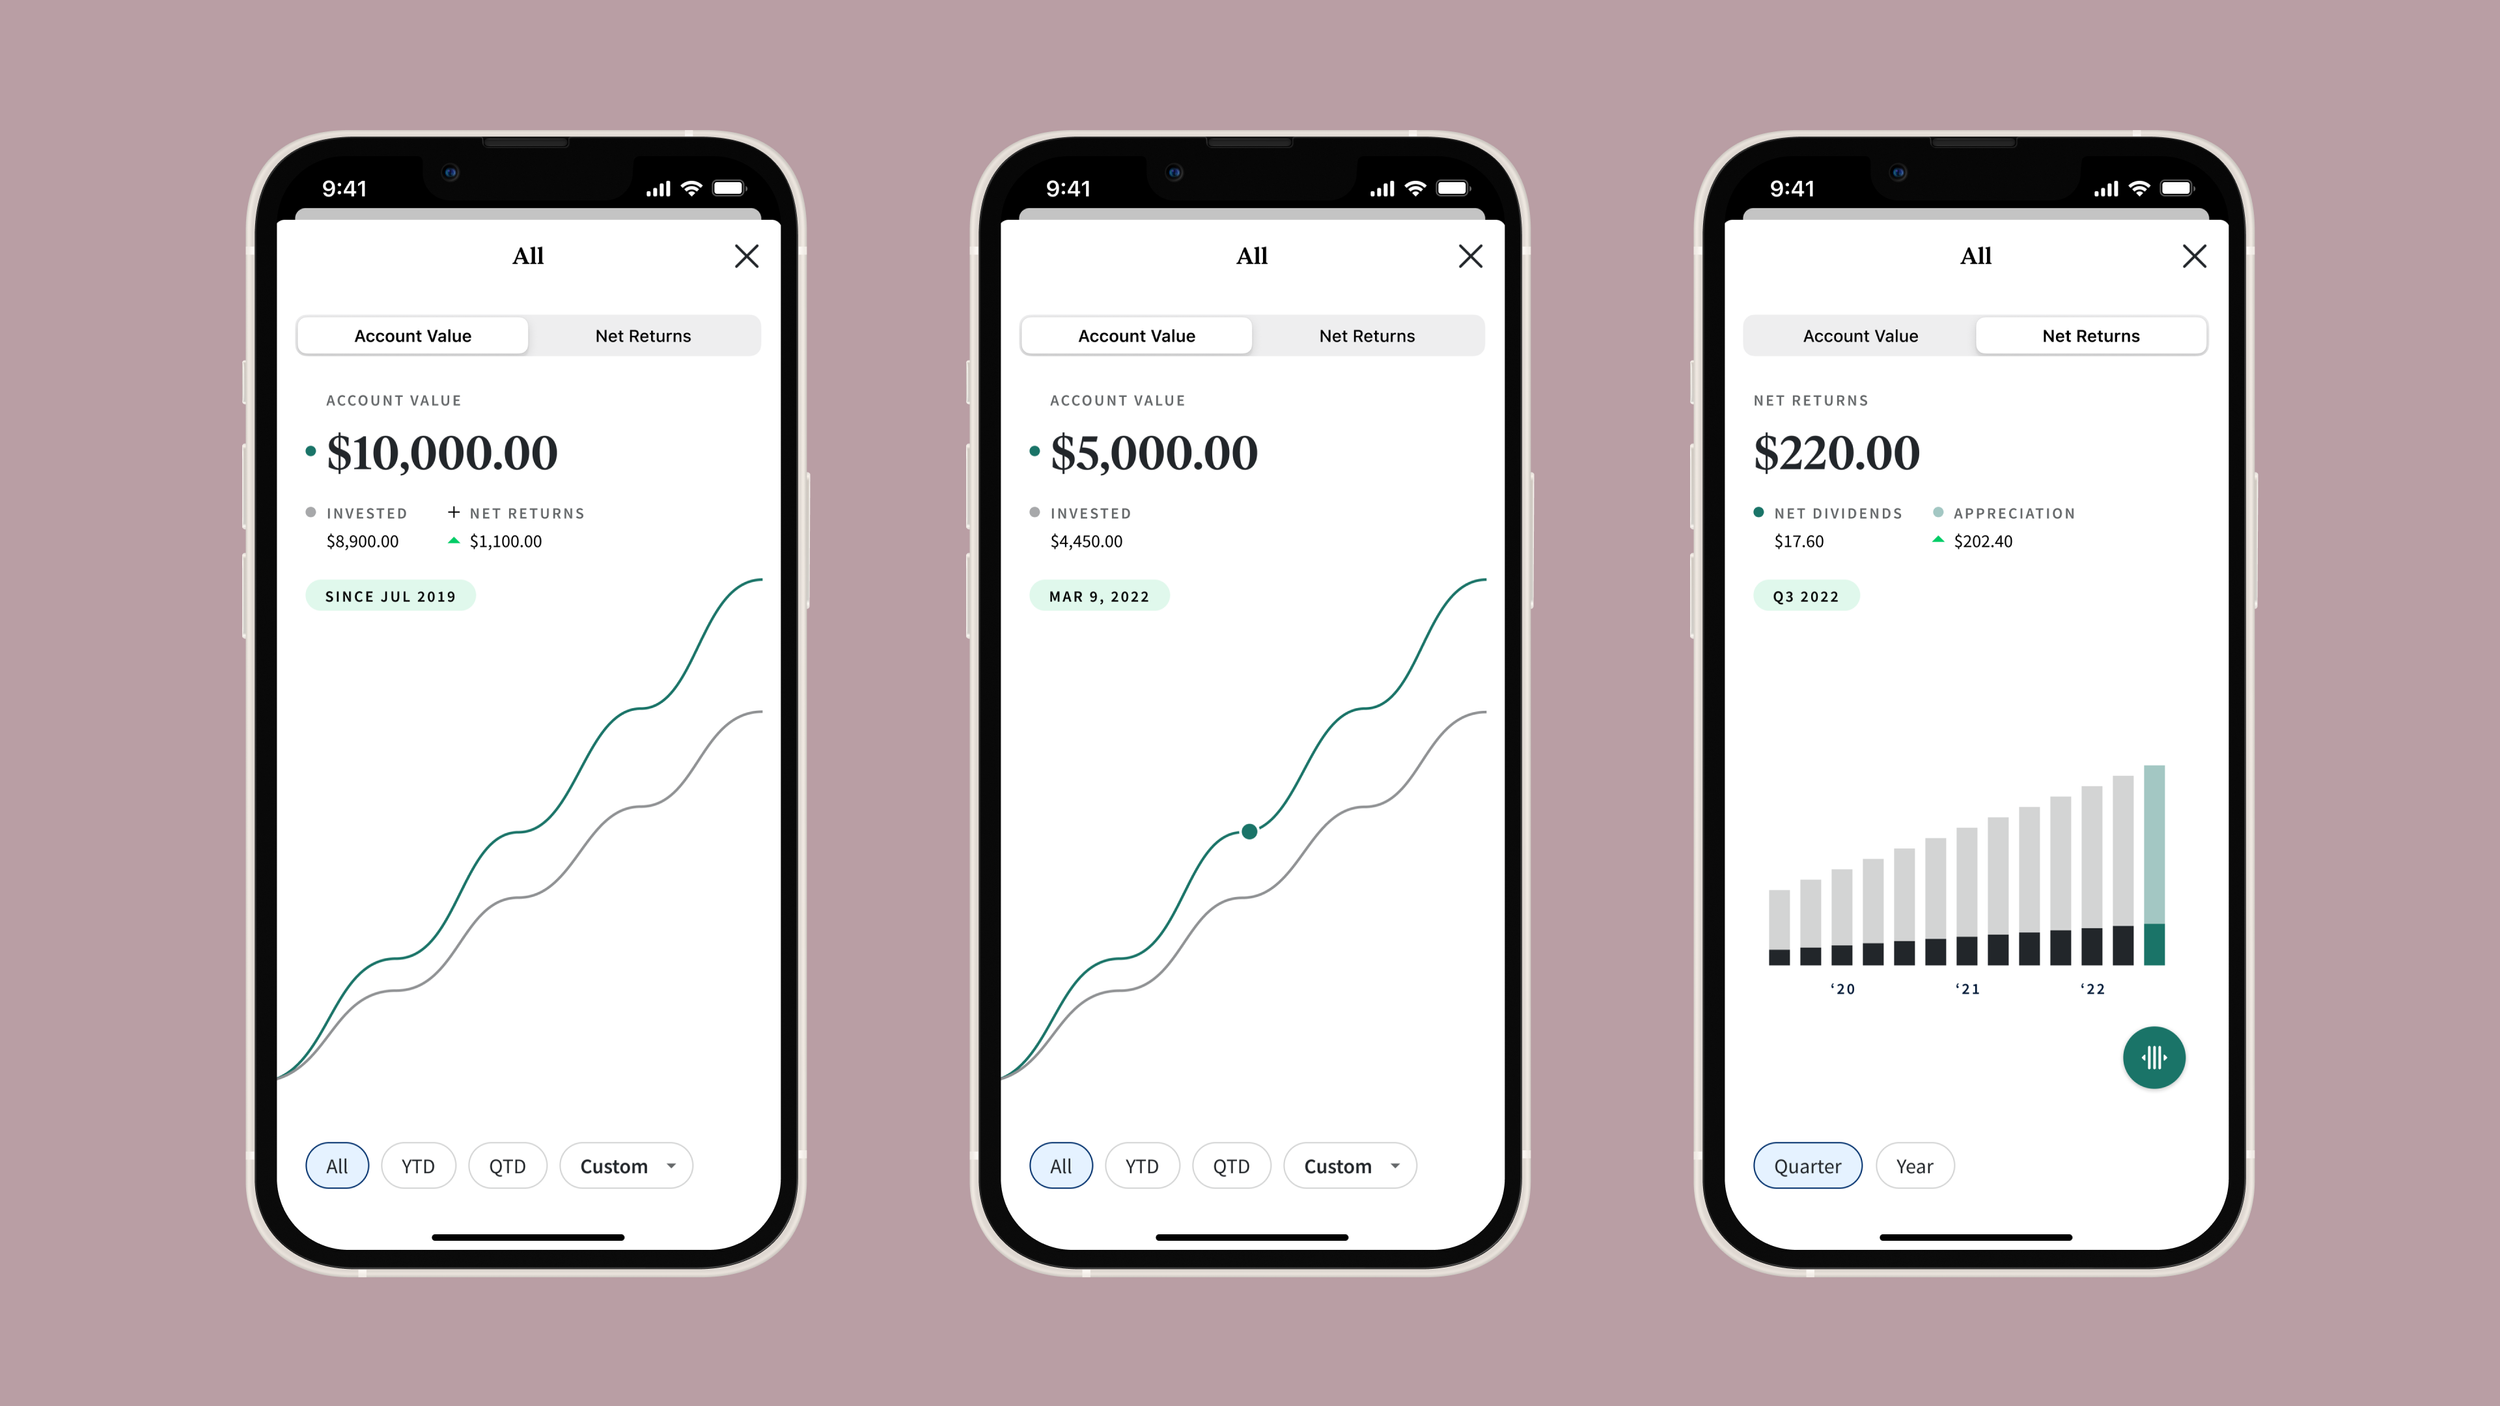
FULL SCREEN CHARTING
From left to right: Full screen account value for all asset types; Full screen account value for all asset types shown in the tracked state; Full screen net returns bar chart for all asset types by quarter.
in-depth content
The most information dense views – drill downs from the Asset Type Details page.

FUNDS
Investors have access to details of their allocation to a specific Fundrise fund from the asset type detail view.

PROPERTY VIEWS
From the asset type detail view, investors can drill down further to view all properties in their portfolio or filter and sort by a variety of categorizations.
Desktop
Desktop documentation coming soon*